Academic Writing Sample Task 1 #2
IELTS Tip
Each time you come across any form of graph, chart or table, study it carefully and practise picking out the major changes that the figure shows. Imagine that you are explaining to someone else what you have noticed from the graph.
You should spend about 20 minutes on this task.
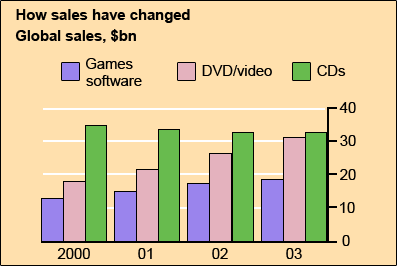
The chart below gives information about global sales of games software, CDs and DVD or video.
Summarise the information by selecting and reporting the main features, and make comparisons where relevant.
Write at least 150 words.

Model answer
The chart shows the changes in the sales of video material / DVDs, games software and CDs around the world in billions of dollars over a three-year period. It can be seen that the sales of videos / DVDs and games software have increased, while the sales of CDs have gone down slightly.
Between 2000 and 2003, the sale of videos and DVDs rose by approximately 13 billion dollars. In 2000, just under 20 billion dollars worth of these items were sold, but in 2003, this figure had risen to a little over 30 billion dollars.
The sales of games software also rose during this period, but less sharply. Sales increased from about 13 billion dollars in 2000 to just under 20 billion dollars three years later. By contrast, during the same time period, the sale of CDs fell from 35 billion dollars in 2000 to about 32.5 billion dollars in 2003.
(152 words)