IELTS Writing 5 - Task 1
Tables
You should spend about 20 minutes on this task.
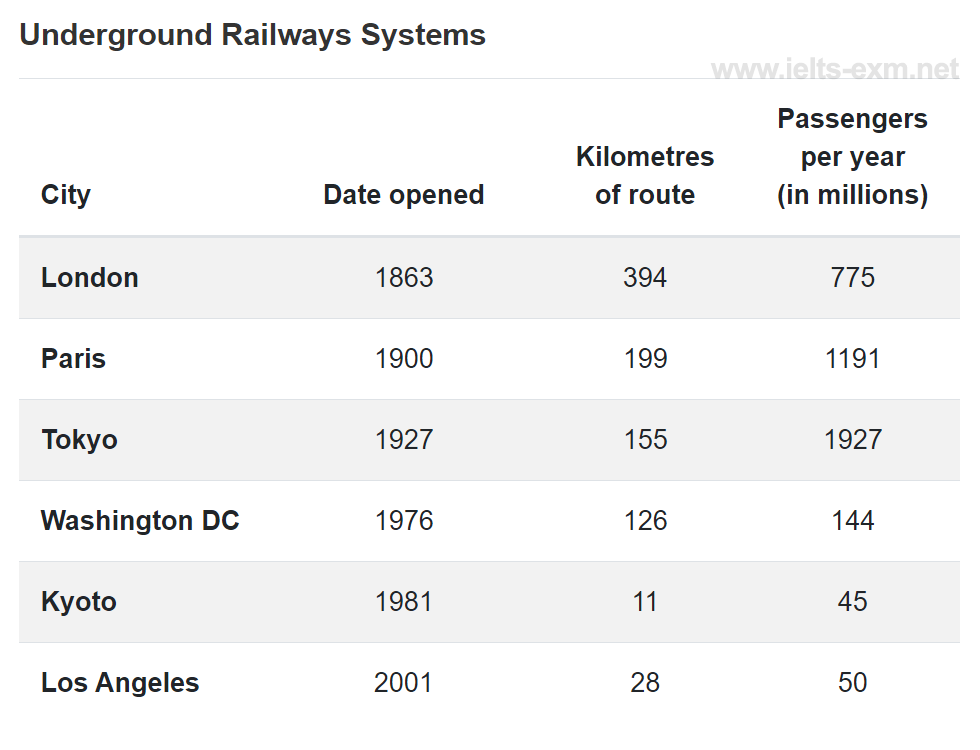
The take below gives information about the underground railway systems in six cities.
Summarise the information by selecting and reporting the main features, and make comparisons where relevant.
Write at least 150 words.

Candidate answer
The table shows the details regarding the underground railway systems in six cities.
London has the oldest underground railway systems among the six cities. It was opened in the year 1863, and it is already lye years old. Paris is the second oldest, in which it was opened in the year 1900. This was then followed by the opening of the railway systems in Tokyo, Washington DC and Kyoto. Los Angeles has the newest underground railway system, and was only opened in the year 2001. In terms of the size of the railway systems, London, For certain, has the largest underground railway systems. It has 394 kilometres of route in total, which is nearly twice as large as the system in Paris. Kyoto, in contrast, has the smallest system. It only has 11 kilometres of route, which is more than 30 times less than that of London.
Interestingly, Tokyo, which only has 155 kilometres of route, serves the greatest number of passengers per year, at 1927 million passengers. The system in Paris has the second greatest number of passengers, at 1191 million passengers per year. The smallest underground railway system, Kyoto, serves the smallest number of passengers per year as predicted.
In conclusion, the underground railway systems in different cities vary a lot in the site of the system, the number of passengers served per year and in the age of the system.
(233 words)
EXAMINER’S EXPLANATION
This is an answer written by a candidate who achieved a Band 7 score. Here is the examiner's comment:
This answer selects and describes the information well. Key features are clearly identified, while unexpected differences are highlighted and illustrated. The answer is relevant and accurate with a clear overview.
Information is well-organised using a good range of signals and link words. These are generally accurate and appropriate, although occasional errors occur.
The writer successfully uses some less common words. There is a clear awareness of style but there are occasional inaccuracies and there is some repetition. Grammar is well-controlled and sentences are varied and generally accurate with only minor errors.