Academic Training Writing - Task 1
You should spend about 20 minutes on this task.
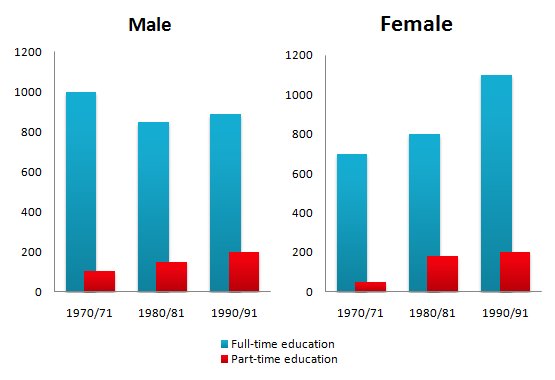
The chart below shows the number of men and women in further education
in Britain in three periods and whether they were studying fulltime or
part-time.
Summarise the information by selecting and reporting the main features, and make
comparisons where relevant.
Write at least 150 words.

model answer 1:
This is a bar chart of the number of men and women in further education in
Britain in three periods. In 1970, Most of Men were studying part-time but from
1980, studying part-time as decreased and studying full-time was increased and
in 1990, it was twice as many students as in 1970. On the other hand, Women
studying Full-time were increased and not only Full-time, part-time also were
increased. In 1990, studying full-time was three times as many students as in
1970. If compare Men and Women, as you see, in 1970, Men were studying more than
women full-time or part-time but it changed from 1980 and then, in 1990, Women
were studying part-time more than Men and studying full-time was same number.
It shows you women has a high education now.
(132 words)
EXAMINER’S EXPLANATION
Band 5
“The length of the answer is just acceptable. There is a good attempt to
describe the overall trends but the content would have been greatly improved if
the candidate had included some reference to the figures given on the graph.
Without these, the reader is lacking some important information. The answer is
quite difficult to follow and there are some punctuation errors that cause
confusion. The structures are fairly simple and efforts to produce more complex
sentences are not successful.”
model answer 2:
According to this graph, the number of men and women in farther education in
Britain shows that following pattern.
In the case of male, the number of male has declined slightly from about 100
thousands in 1970/71 to about 850 thousands in 1990/91. However, this figure
rose back to about 850 thousands in 1990/91 from about 820 thousands in 1980/81.
The proportion of full-time education has declined during this period. However,
the proportion of part-time education has increased dramatically.
On the other hand, in the case of female, the number of both full-time education
and part-time education has increased during the period.
From about 700 thousands in 1970/71, these figures rose to about 820 thousands
in 1980/81, to about 1100 thousands in 1990/91.
In terms of full-time education, this figure rose by about 260 to about 900 in
1990/91.
On the other hand, with respect to part-time education, this figure rose
dramatically between 1980/81 and 1970/71. However this figure rose slightly
between 1980/81 and 1990/91.
(165 words)
EXAMINER’S EXPLANATION
Band 6
“The candidate has made a good attempt to describe the graphs looking at
global trends and more detailed figures. There is, however, some information
missing and the information is inaccurate in minor areas. The answer flows quite
smoothly although connectives are overused or inappropriate, and some of the
points do not link up well. The grammatical accuracy is quite good and the
language used to describe the trends is well-handled. However, there are
problems with expression and the appropriate choice of words and whilst there is
good structural control, the complexity and variation in the sentences are
limited.”
