IELTS Writing 6 - Task 1
IELTS Tip
In 150 words you cannot include a detailed description of all the changes, so you must decide which parts it is important for the reader to know and in how much detail. Decide which points to summarise, which to group together and which parts to ignore.
You should spend about 20 minutes on this task.
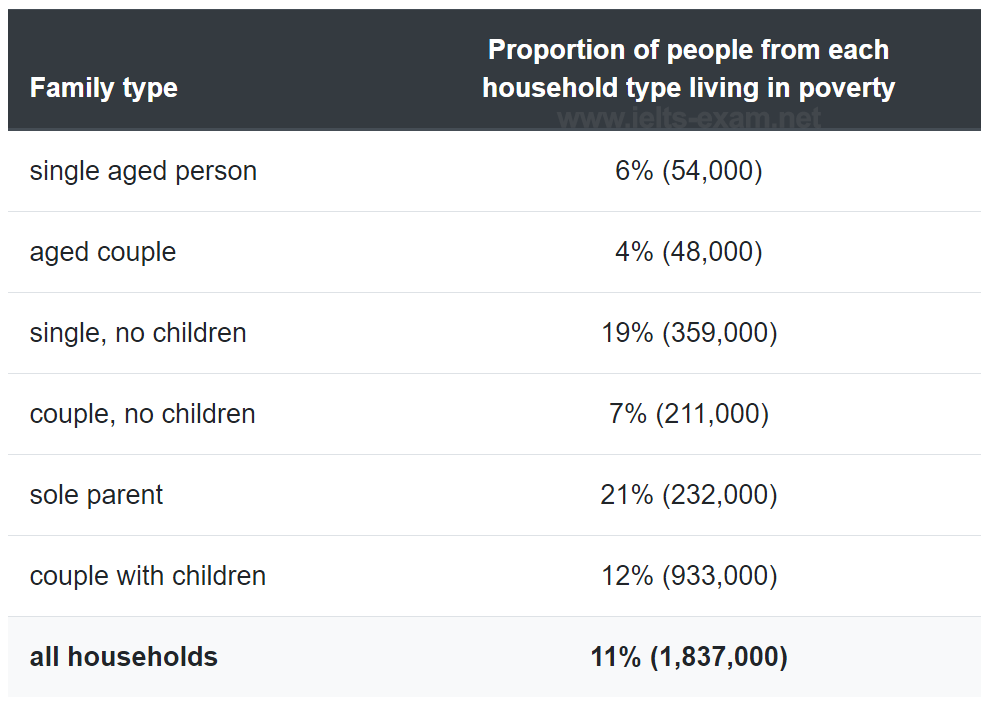
The table below shows the proportion of different categories of families living in poverty in Australia in 1999.
Summarise the information by selecting and reporting the main features, and make comparisons where relevant.
Write at least 150 words.

Model answer
The table gives a breakdown of the different type of family who were living in poverty in Australia in 1999.
On average, 11% of all households, comprising almost two million people, were in this position. However, those consisting of only one parent or a single adult had almost doubt this proportion of poor people, with 21% and 19% respectively.
Couples generally tended to be better off, with lower poverty levels for couples without children (7%) than those with children (12%). It is noticeable that for both types of household with children, a higher than average proportion were living in poverty at this time.
Older people were generally less likely to be poor, though once again the trend favoured elderly couples (only 4%) rather than single elderly people (6%).
Overall the table suggests that households of single adults and those with children were more likely to be living in poverty than those consisting of couples.
(154 words)