Line Graph
One of the most common types of chart seen in IELTS Writing Task 1 is the line graph. It is important that you become comfortable with identifying and analysing the information contained in each graph.
Sample Questions
UK and Australia cinema admissions, 1976 to 2006
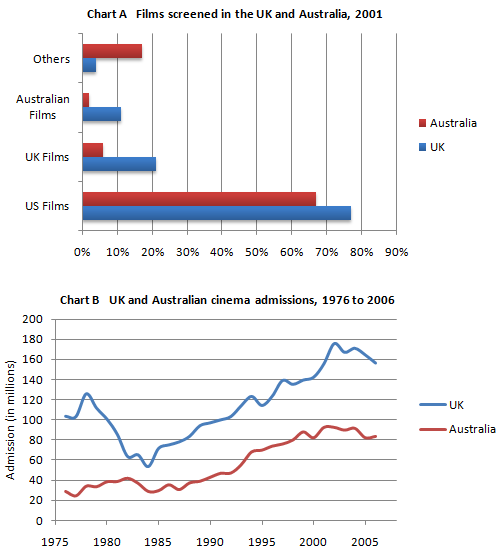
The graph shows cinema admission in the UK and Australia from 1976 to 2006.
Summarise the information by selecting and reporting the main features, and make comparisons where relevant.
Typical daily demand for electricity
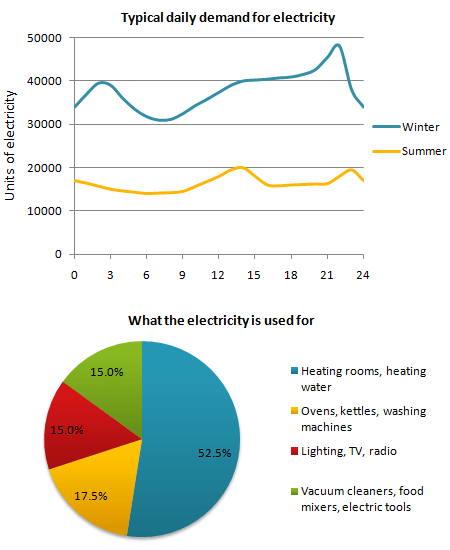
The graph shows the demand for electricity in England during typical days in winter and summer.
Summarise the information by selecting and reporting the main features, and make comparisons where relevant.
Unemployement Rates: US and Japan
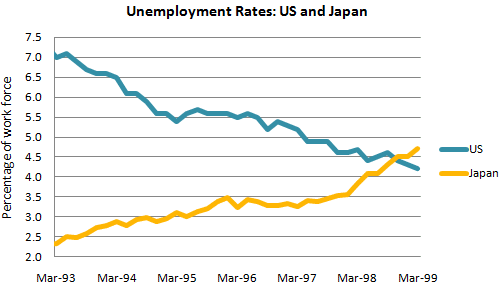
The graph shows the unemployment rates in the US and Japan between March 1993and March 1999.
Summarise the information by selecting and reporting the main features, and make comparisons where relevant.
Radio and Television audiences in UK
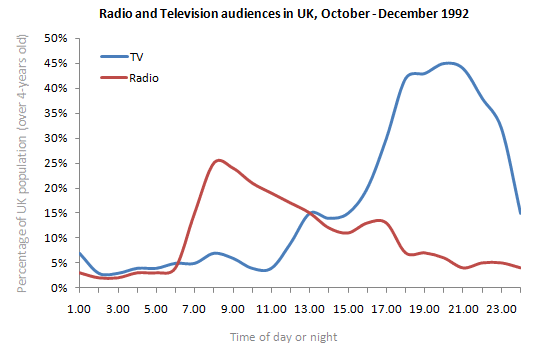
The graph shows the unemployment rates in the US and Japan between March 1993and March 1999.
Summarise the information by selecting and reporting the main features, and make comparisons where relevant.
Wheat Exports 1985-1990
The graph shows the differences in wheat exports over three different areas.
Summarise the information by selecting and reporting the main features, and make comparisons where relevant.
Global water use by sector
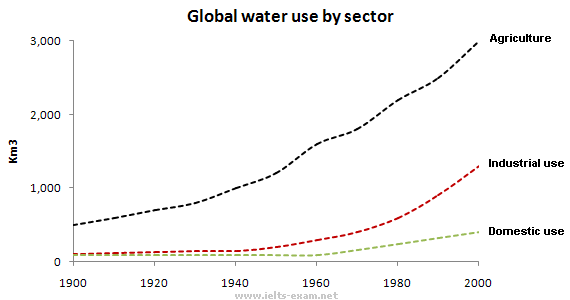
The graph and table give information about water use worldwide and water consumption in two different countries.
Summarise the information by selecting and reporting the main features, and make comparisons where relevant.
Visits to two new music websites
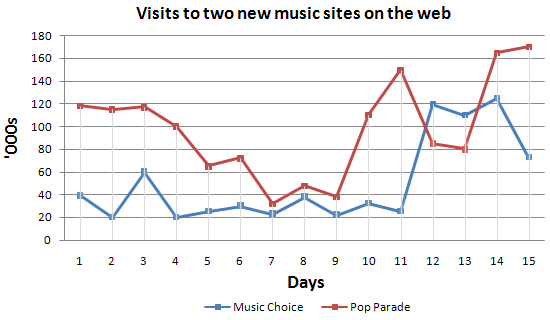
The graph compares the number of visits to two new music websites.
Summarise the information by selecting and reporting the main features, and make comparisons where relevant.
Fast Food vs. Sit-down Restaurants
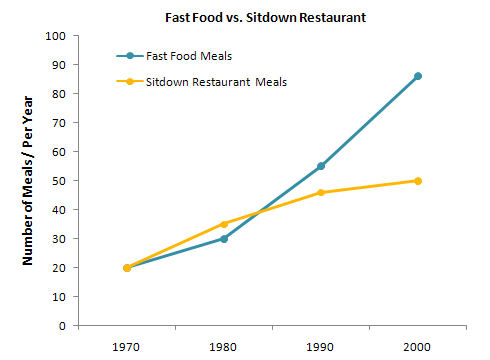
The graph shows the number of meals eaten in fast food restaurants and sit-down restaurants.
Summarise the information by selecting and reporting the main features, and make comparisons where relevant.
Flu Rates for Males and Females
In June 1996, an experimental flu vaccine was trialled in a large country town on females only.
Summarise the information by selecting and reporting the main features, and make comparisons where relevant.
Visitors to Australia by overseas residents
The line graph shows the number of annual visits to Australia by overseas residents.
Summarise the information by selecting and reporting the main features, and make comparisons where relevant.